

Opening the Intake page
Open Intake from the left sidebar, or press T from anywhere in the dashboard.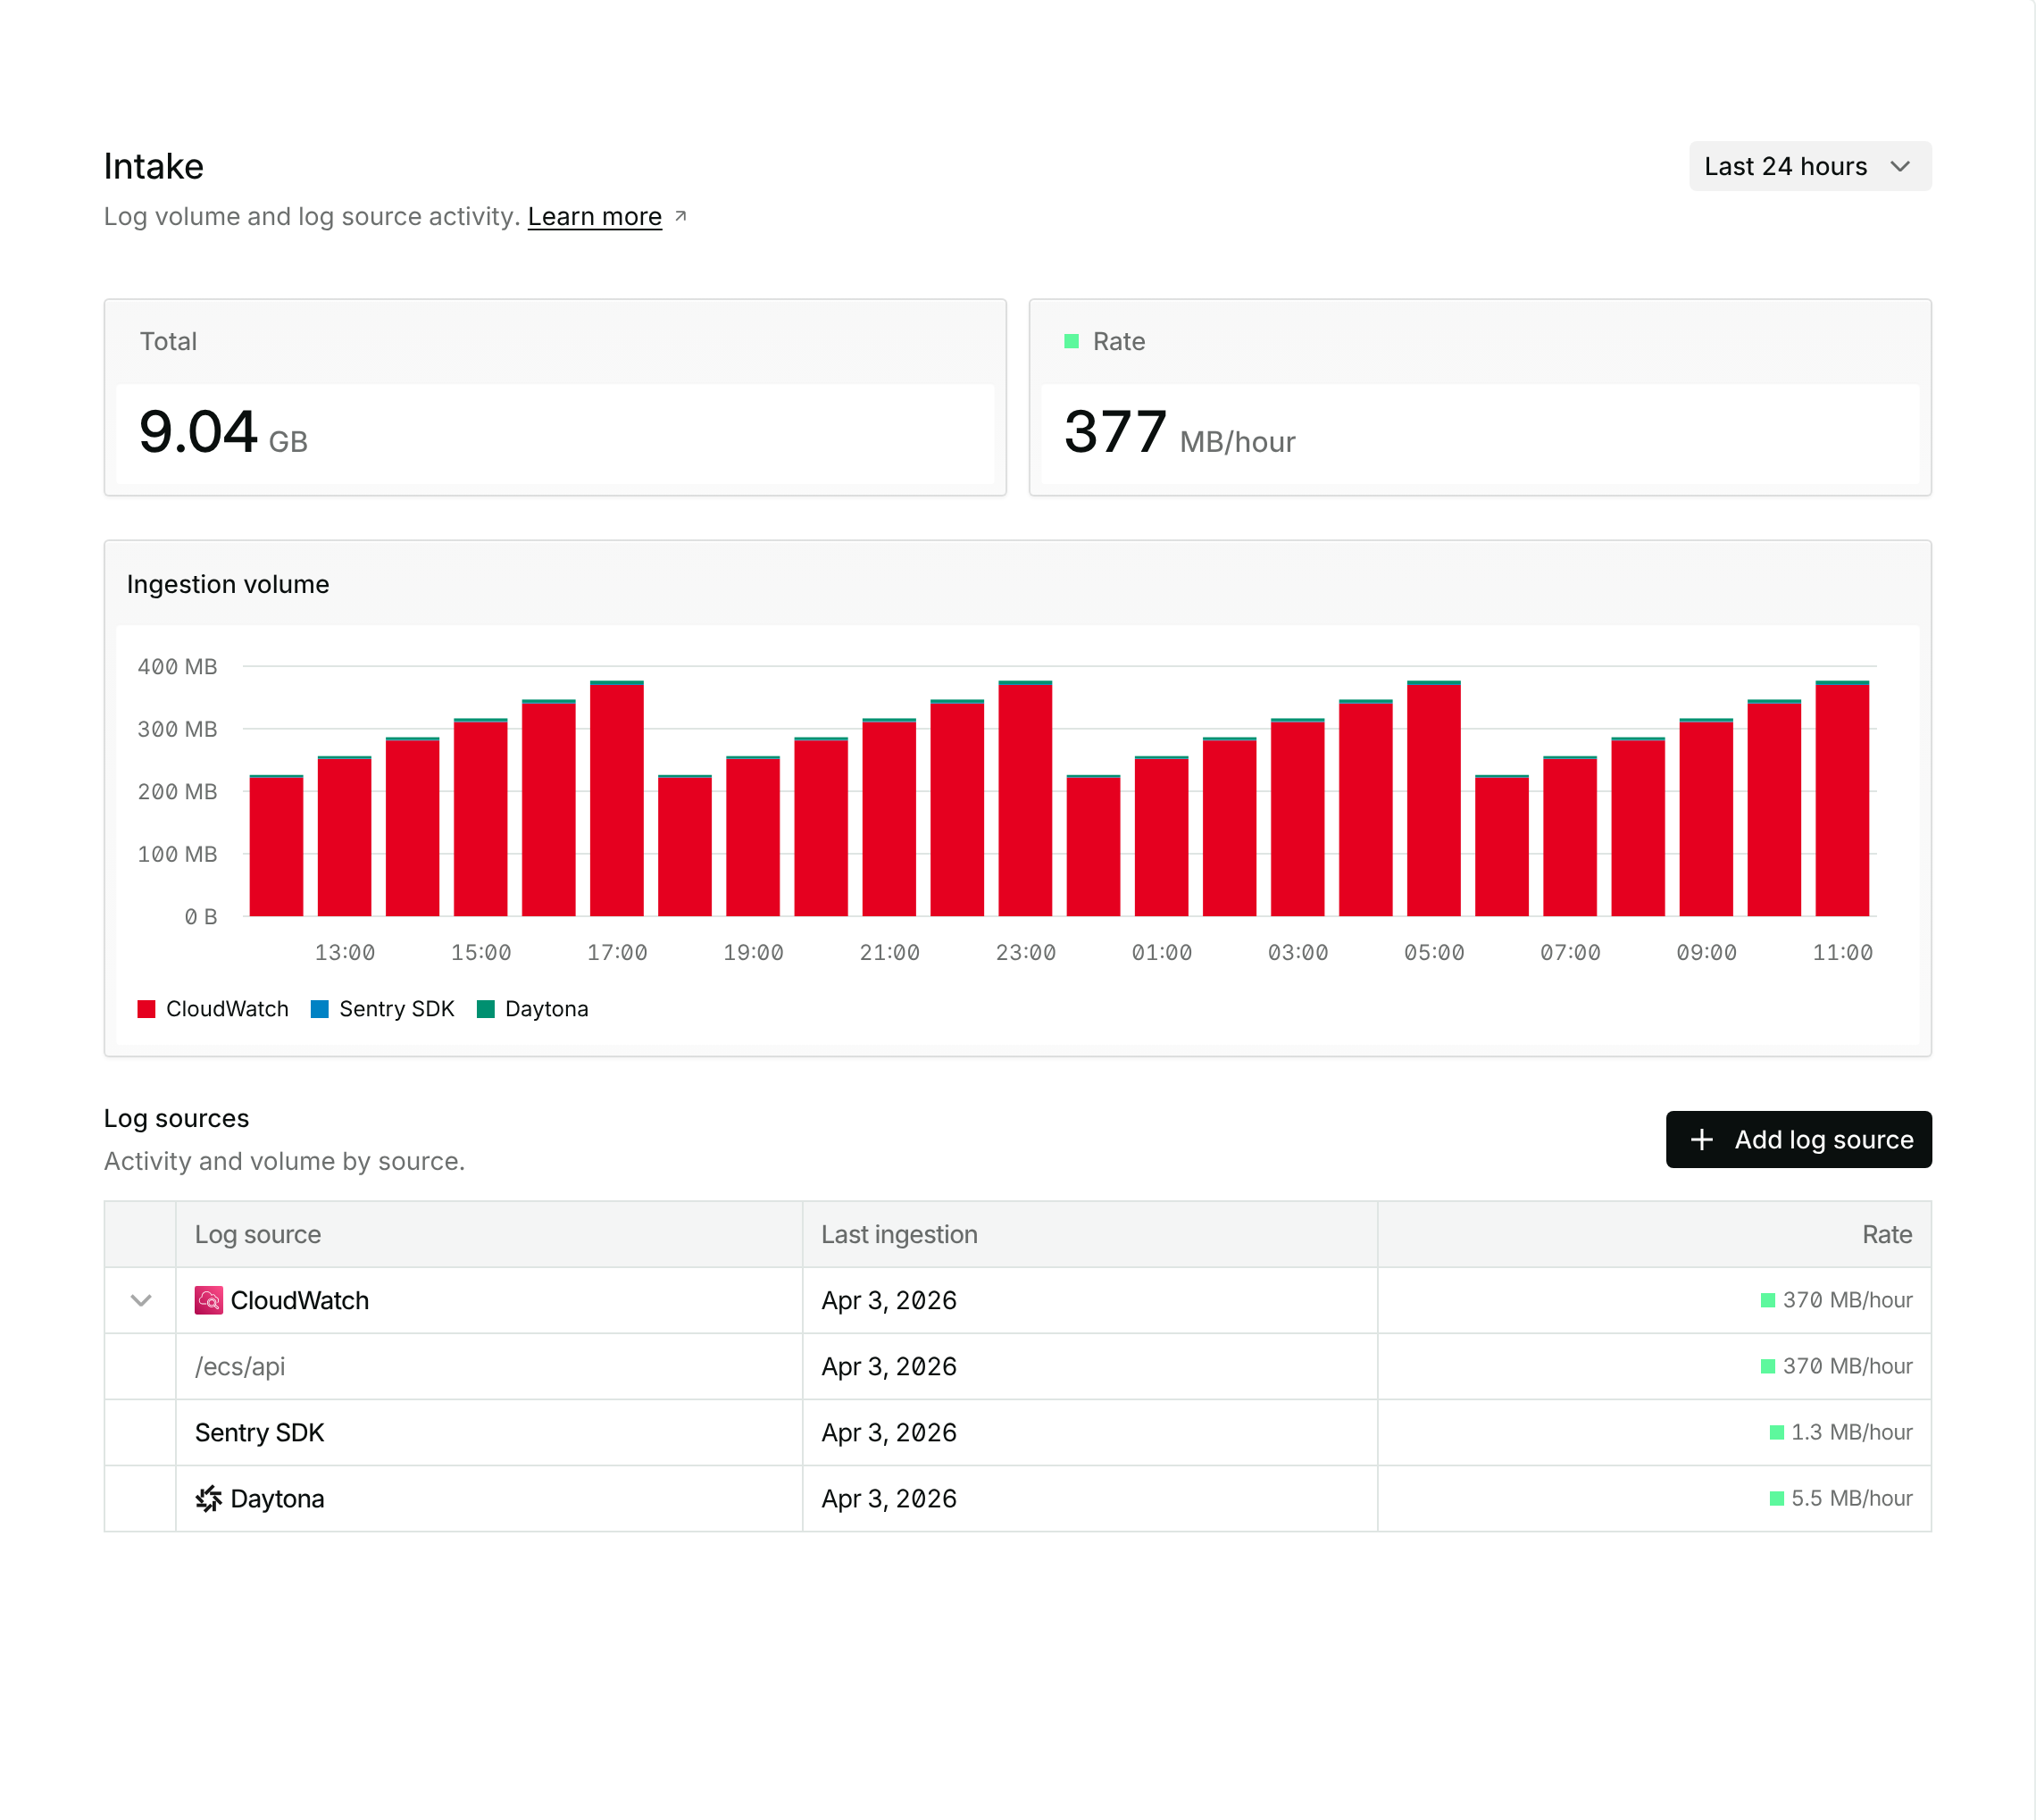
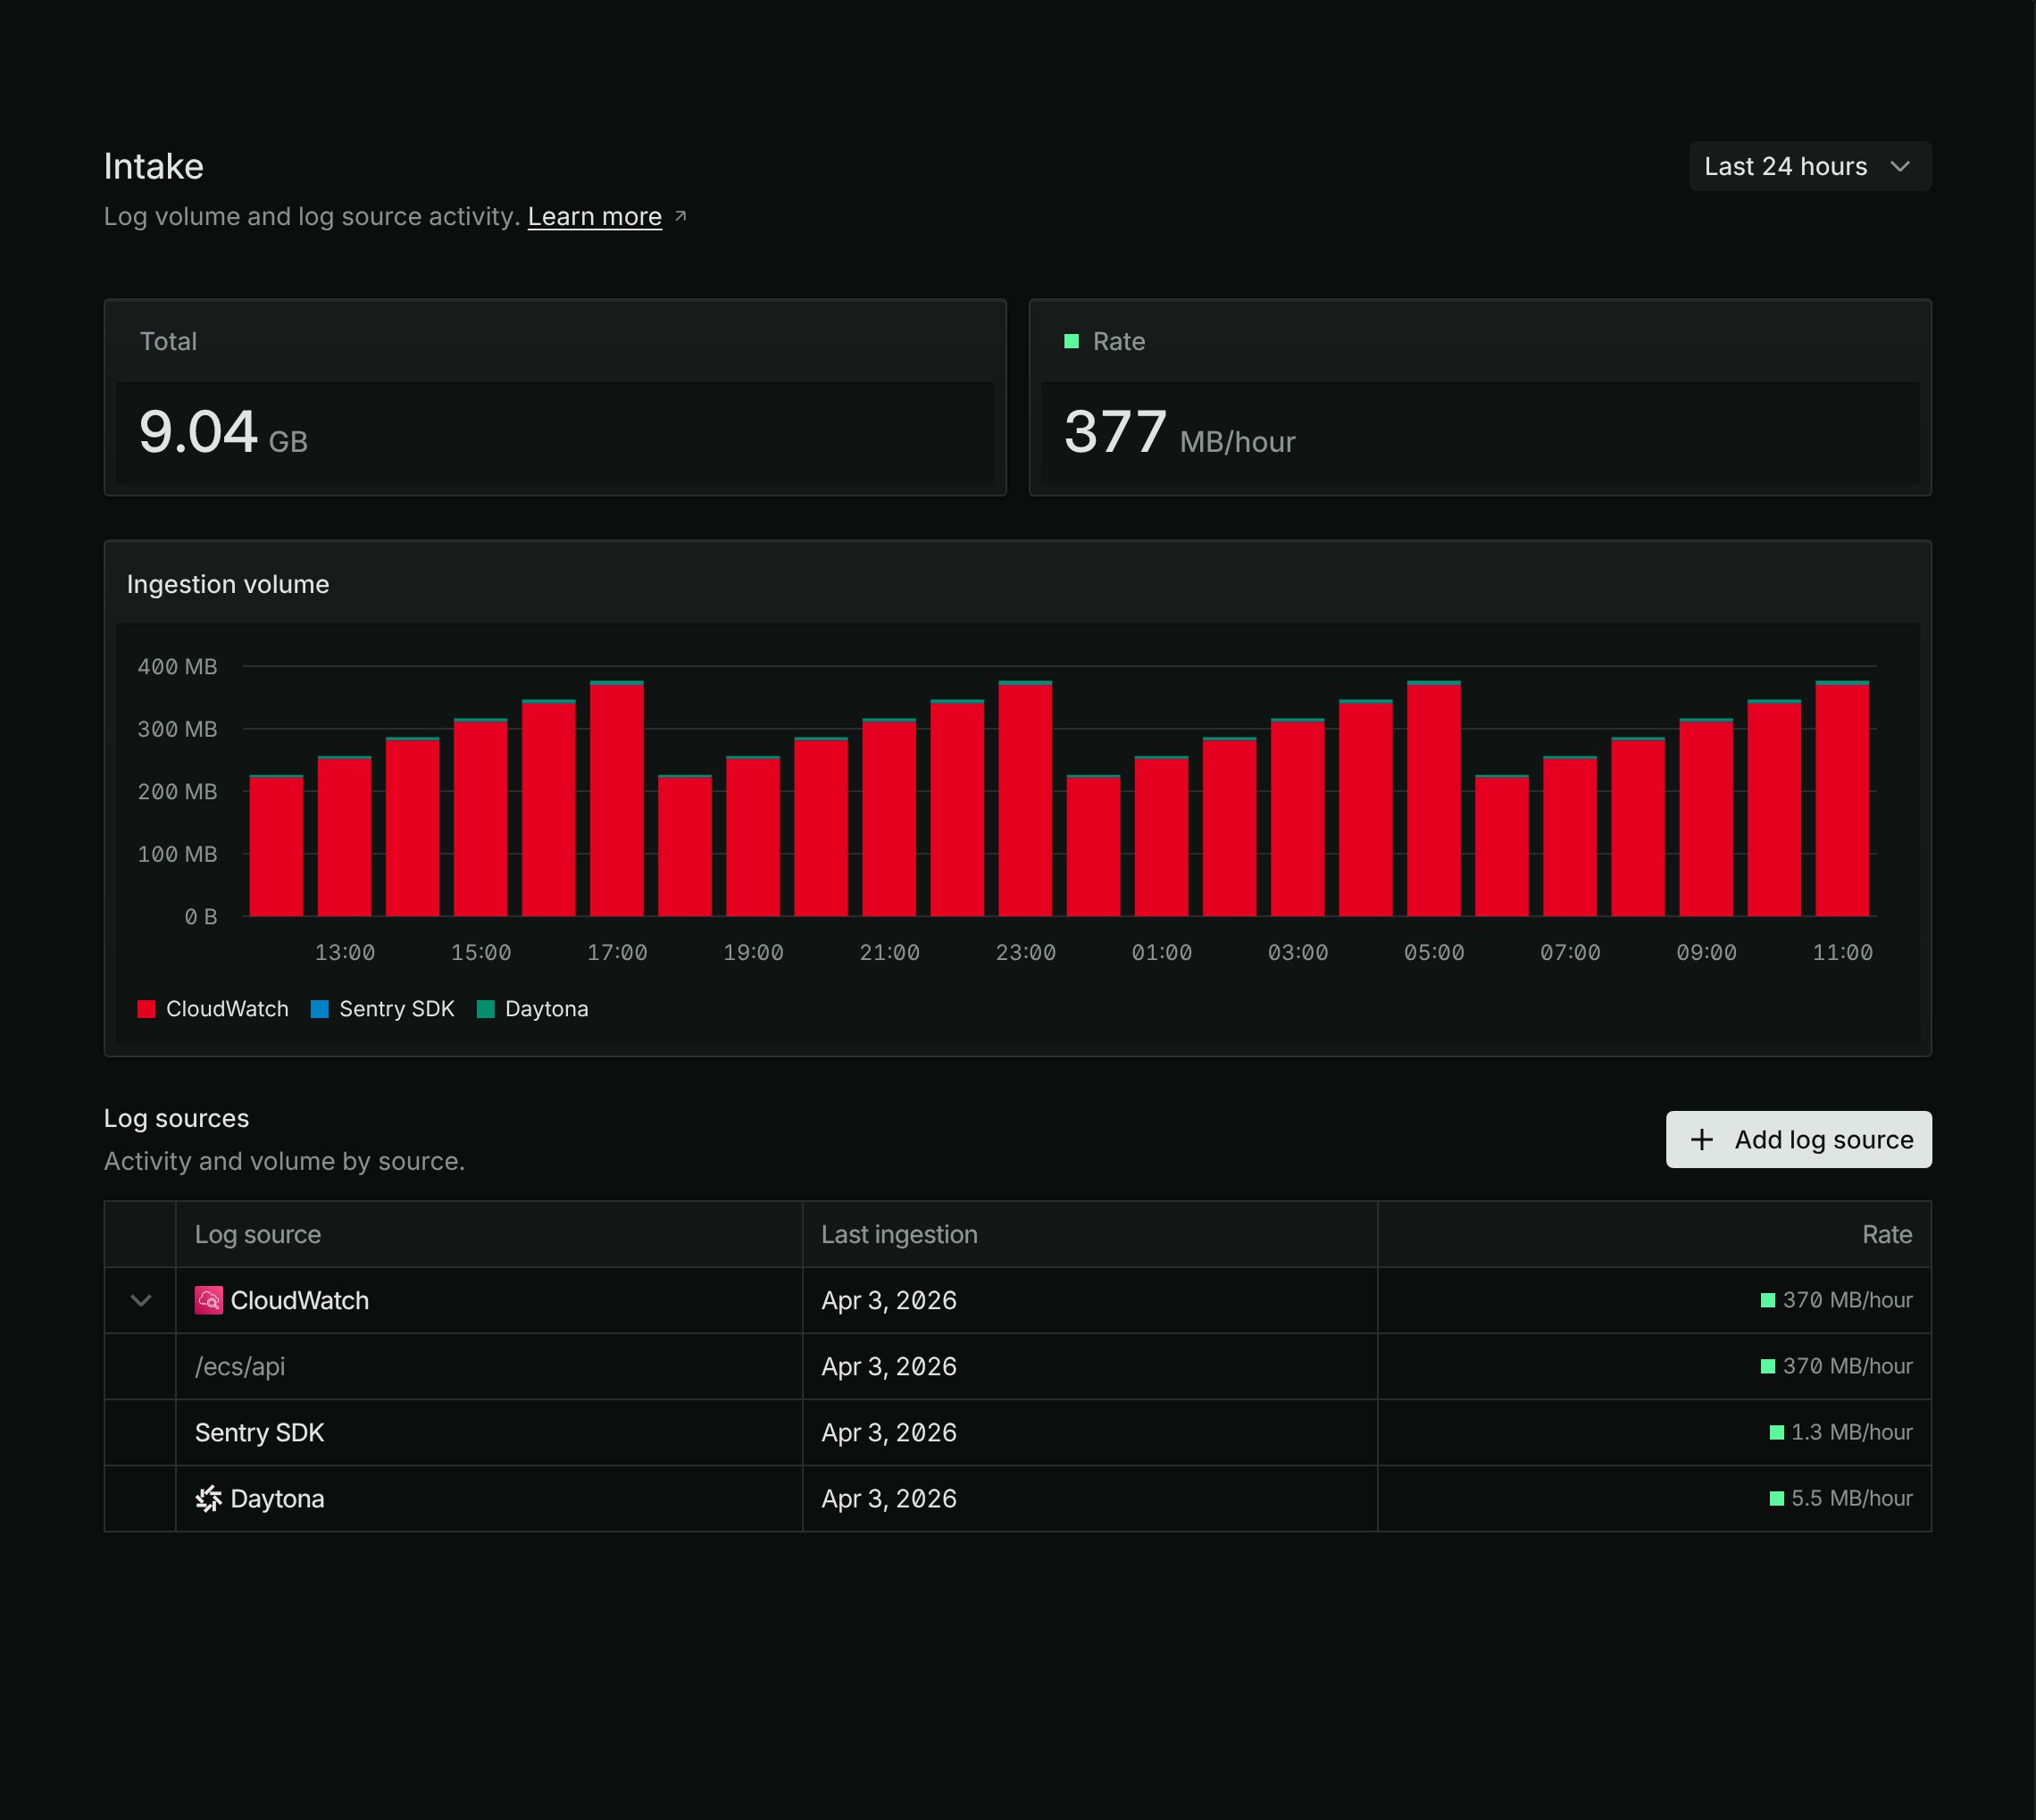
The Intake page, with a 24-hour range selected.
Summary metrics
The top of the page shows two figures for the selected time range:- Total — total bytes ingested across all log sources in the range.
- Rate — the current ingestion rate, with an indicator for whether throughput looks normal.
Ingestion volume over time
A stacked bar chart plots bytes ingested over time, broken down by log source so each source is its own band in the stack. Hover a bar to see the exact bytes per source for that bucket. Select a time range with the presets — 1h, 6h, 24h, 7d, 30d, and 90d — with shorter ranges using finer buckets.Per-source and per-stream activity
Below the chart, a table lists each log source with its recent activity, and you can expand a source to see the individual log streams beneath it. This is where you confirm a specific source or stream is delivering — a source at zero when you expect traffic is the first sign of an ingestion problem.When volume looks wrong
- A source dropped to zero. The source stopped sending, its stream is paused, or the intake URL it uses is wrong. See Troubleshooting ingestion.
- Volume is far higher than expected. A noisy source may be forwarding more than you intend; narrow what it sends at the source.
Further reading
Troubleshooting ingestion
Diagnose missing or malformed logs.